trino-jmx-monitoring
Trino Monitoring (JMX) with Prometheus and Grafana
This repository guides you through the process of setting up monitoring for Trino JMX metrics using Prometheus and Grafana.
Considerations
- This integration is based on the Trino JMX metrics and the Prometheus JMX exporter
- Trino Version: 433, Prometheus Version: 2.50.0, Grafana Version: 9.5.15
Architecture (Docker)
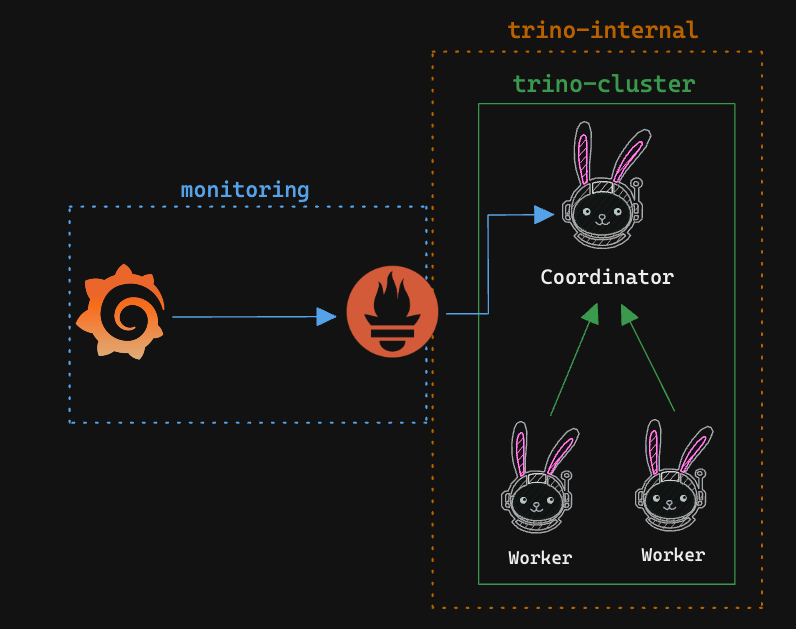
Running Trino Cluster Locally
Prerequisites
- Please make sure you have minimum of 8GB RAM and 4 CPU cores available on your machine to run the Trino cluster locally. Or you can modify the
.envfile to reduce the memory and CPU resources.
Running Trino Cluster
Please modify the .env file to adjust the memory and CPU requirements. For this illustration, memory limit is set to 2GB and CPU limit is set to 1. If you have changed the memory, please make sure to update the jvm.config file with the new memory limits. Read more about JVM Configuration for Trino.
-Xms1792M
-Xmx1792M
Now, start the Trino cluster using the following command.
docker-compose up trino-coordinator trino-worker -d
Setting up JMX configuration
Please follow this official guide to understand monitoring Trino using JMX.
# config.properties

jmx.rmiregistry.port=9080
jmx.rmiserver.port=9080
JVM Configuration for JMX
# jvm.config

-Dcom.sun.management.jmxremote
-Dcom.sun.management.jmxremote.port=9080
-Dcom.sun.management.jmxremote.rmi.port=9080
-Dcom.sun.management.jmxremote.local.only=false
-Dcom.sun.management.jmxremote.authenticate=false
-Dcom.sun.management.jmxremote.ssl=false
-Djava.rmi.server.hostname=127.0.0.1
Monitoring JMX Metrics through JConsole
If you are running the Trino cluster locally on your machine, you can monitor the JMX metrics using JConsole.
jconsole localhost:9080
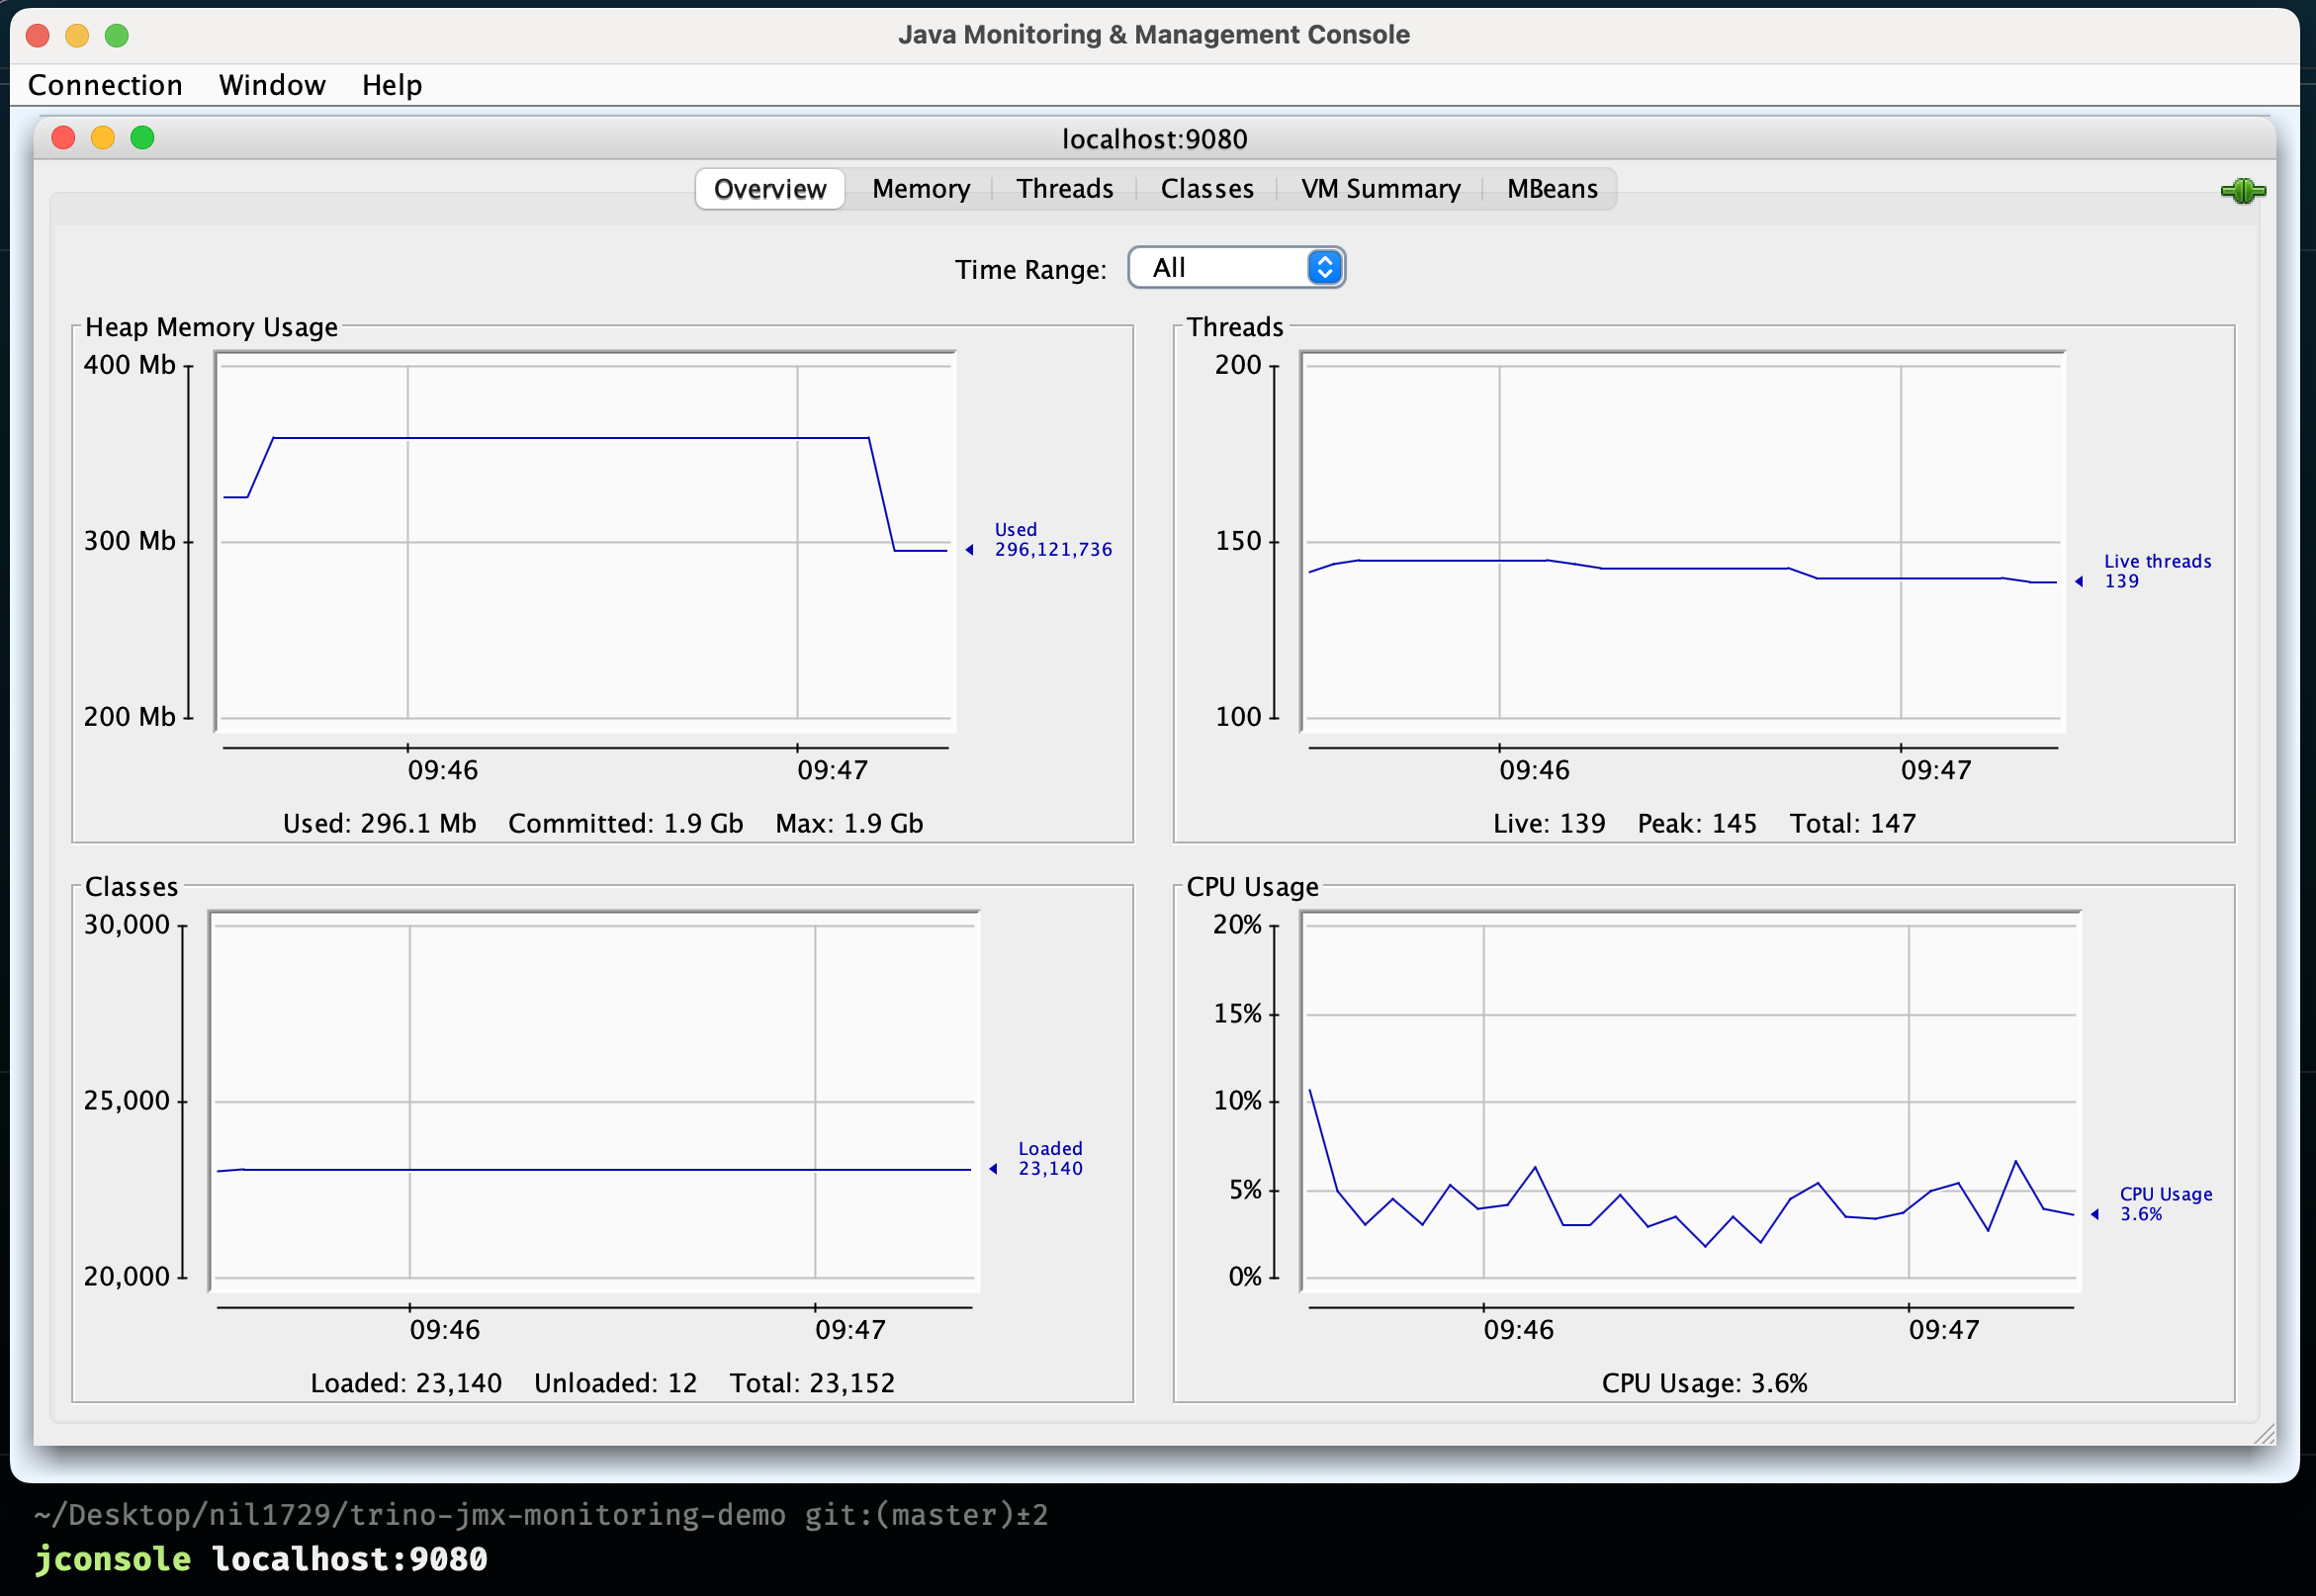
Monitoring JMX Metrics through VisualVM
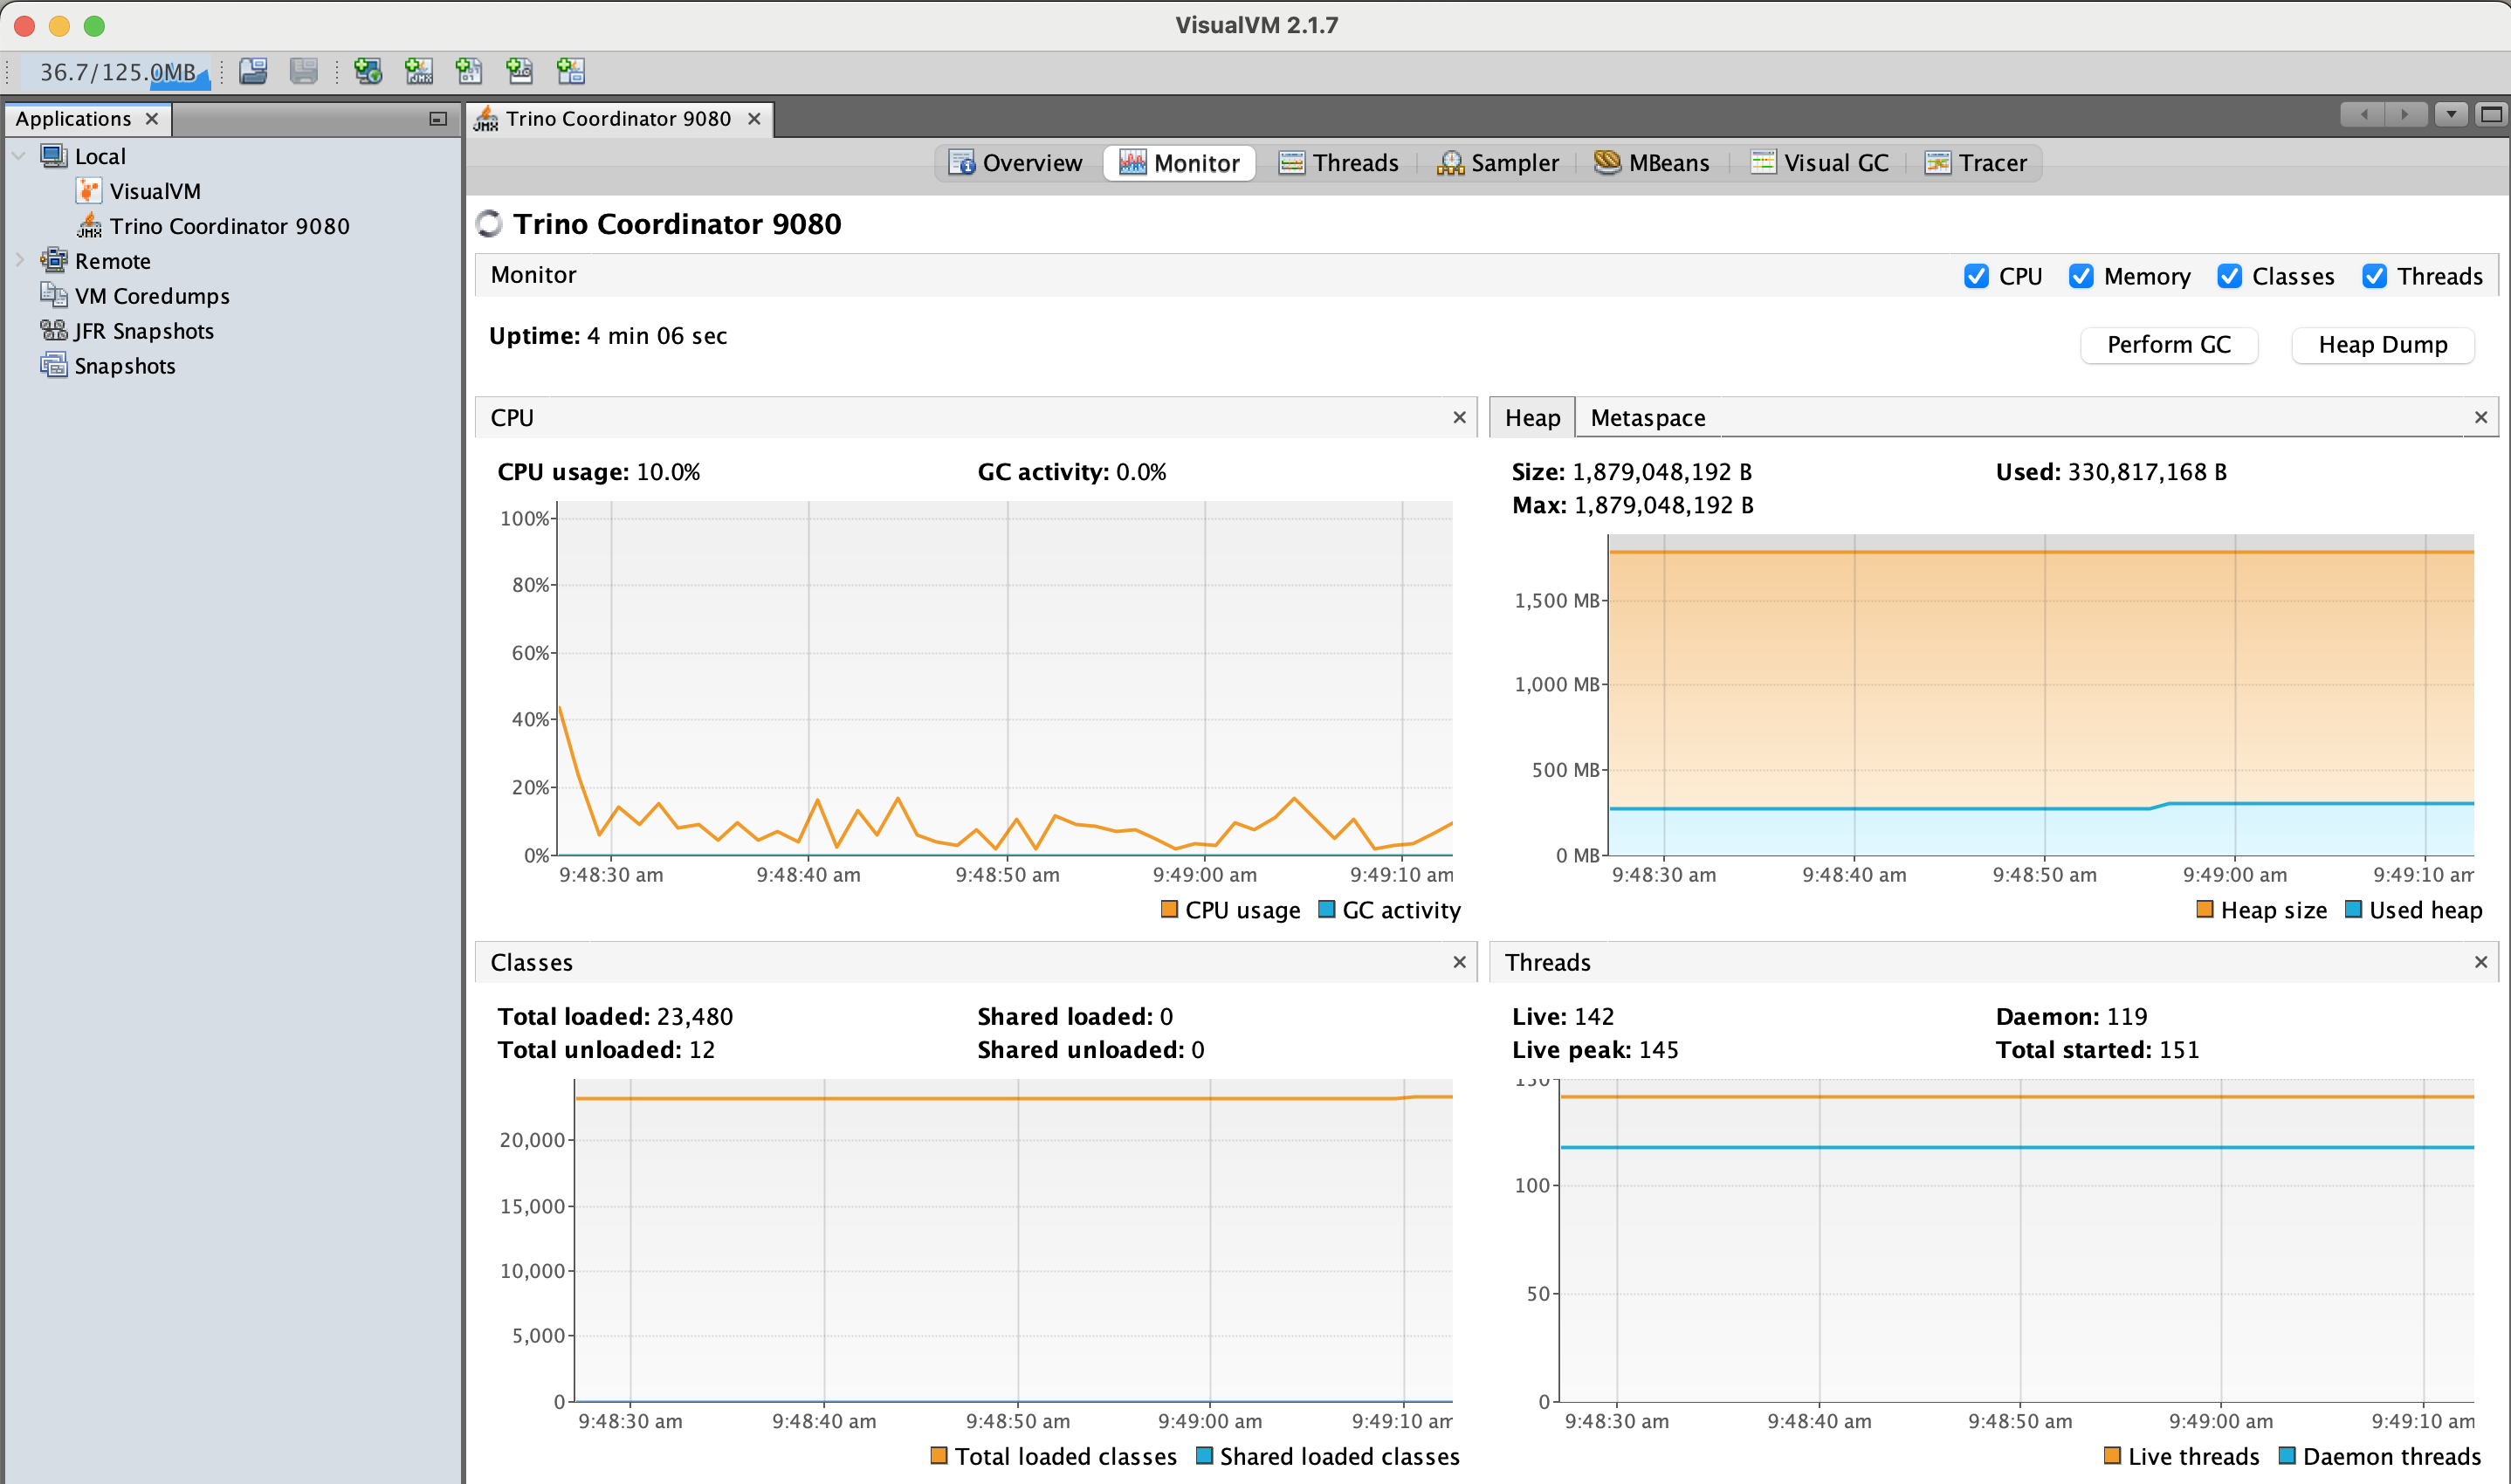
Monitoring JMX Metrics - Cluster running on Remote VM
If you are running the Trino cluster on a remote VM, you can monitor the JMX metrics using JConsole by setting up an SSH tunnel.
ssh -L 127.0.0.1:9080:127.0.0.1:9080 @
JMX Exporter Configuration
To export the JMX metrics to Prometheus, we need to configure the JMX exporter. Please refer to this guide for more details on JMX exporter.
FROM trinodb/trino:433
USER root
# jmx prometheus exporter jar
RUN curl -L https://repo1.maven.org/maven2/io/prometheus/jmx/jmx_prometheus_javaagent/0.20.0/jmx_prometheus_javaagent-0.20.0.jar -o /usr/lib/trino/lib/jmx_prometheus_javaagent.jar
USER trino
# config.yaml (jmx exporter config)

rules:
  - pattern: ".*"
JVM Configuration for JMX Exporter
-javaagent:/usr/lib/trino/lib/jmx_prometheus_javaagent.jar=12345:/etc/trino/jmx/config.yaml
Now restart the Trino cluster to apply the JMX exporter configuration. Once the cluster is up and running, you can access the JMX metrics using the following URL.
http://localhost:12345/metrics
Prometheus Configuration
# prometheus.yml

scrape_configs:
  - job_name: "trino-jmx"
    metrics_path: "/metrics"
    scrape_interval: 5s
    static_configs:
      - targets: ["trino-coordinator:12345"]
        labels:
          instance: "trino-coordinator"
Start the Prometheus Server
docker-compose up prometheus -d
Access Prometheus UI
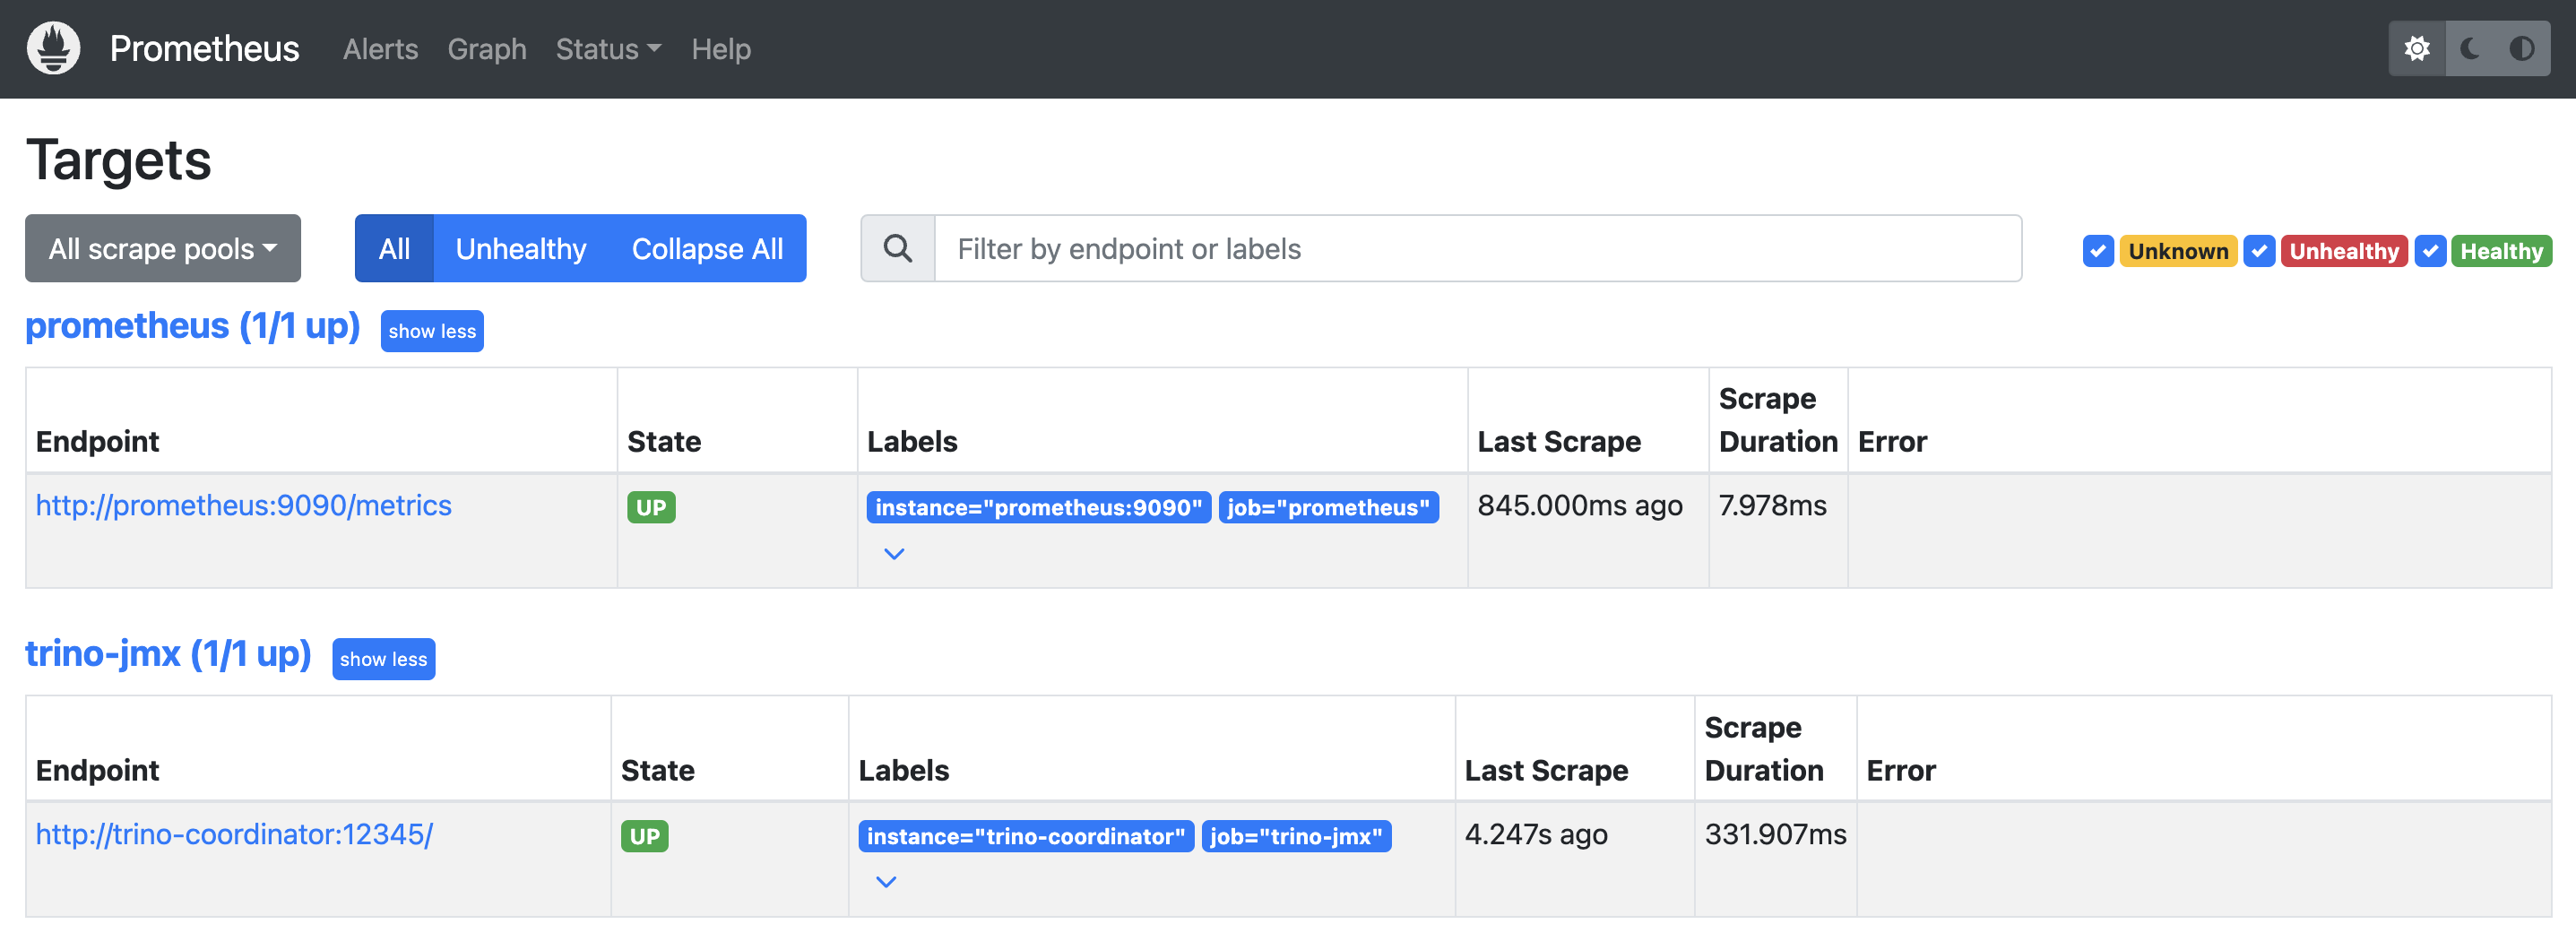
Open the Prometheus UI and check the targets to see if the Trino JMX metrics are being scraped.
http://localhost:9090/targets
Start the Grafana Server
docker-compose up grafana -d
Access Grafana UI
You can access Grafana UI at http://localhost:3000 with the following credentials.
- Grafana Username:
admin - Grafana Password:
password
You can change the password in the .env file.
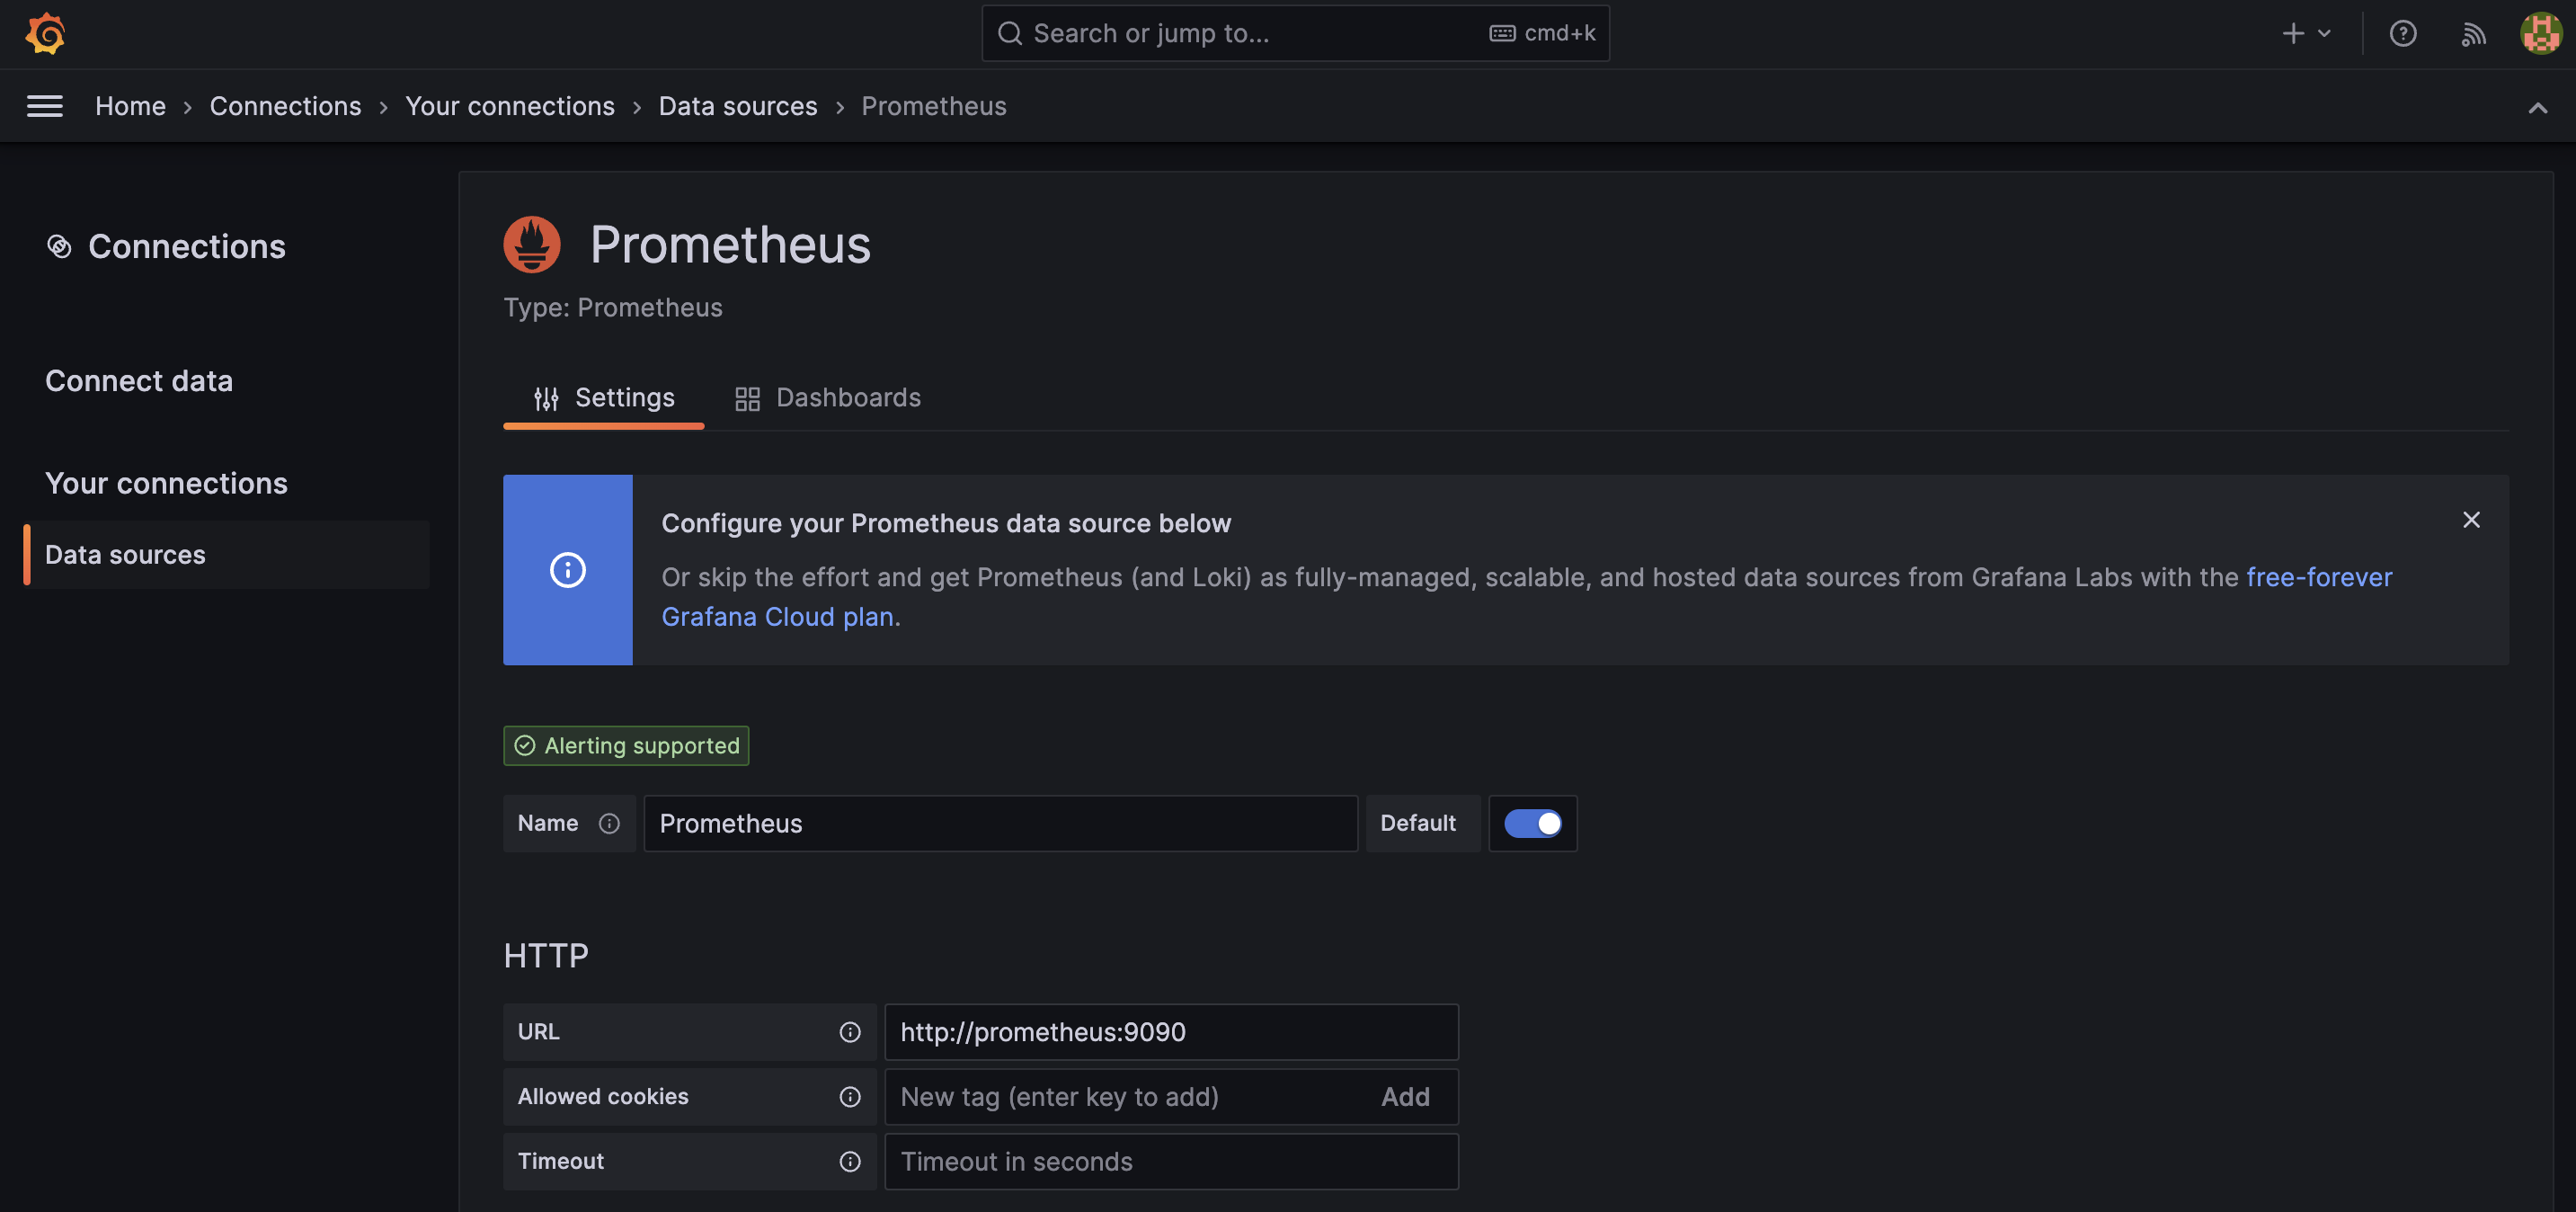
Grafana Data Source Configuration
Open the Grafana UI and configure the Prometheus data source.
http://localhost:3000/connections/your-connections/datasources
Grafana Dashboard Configuration
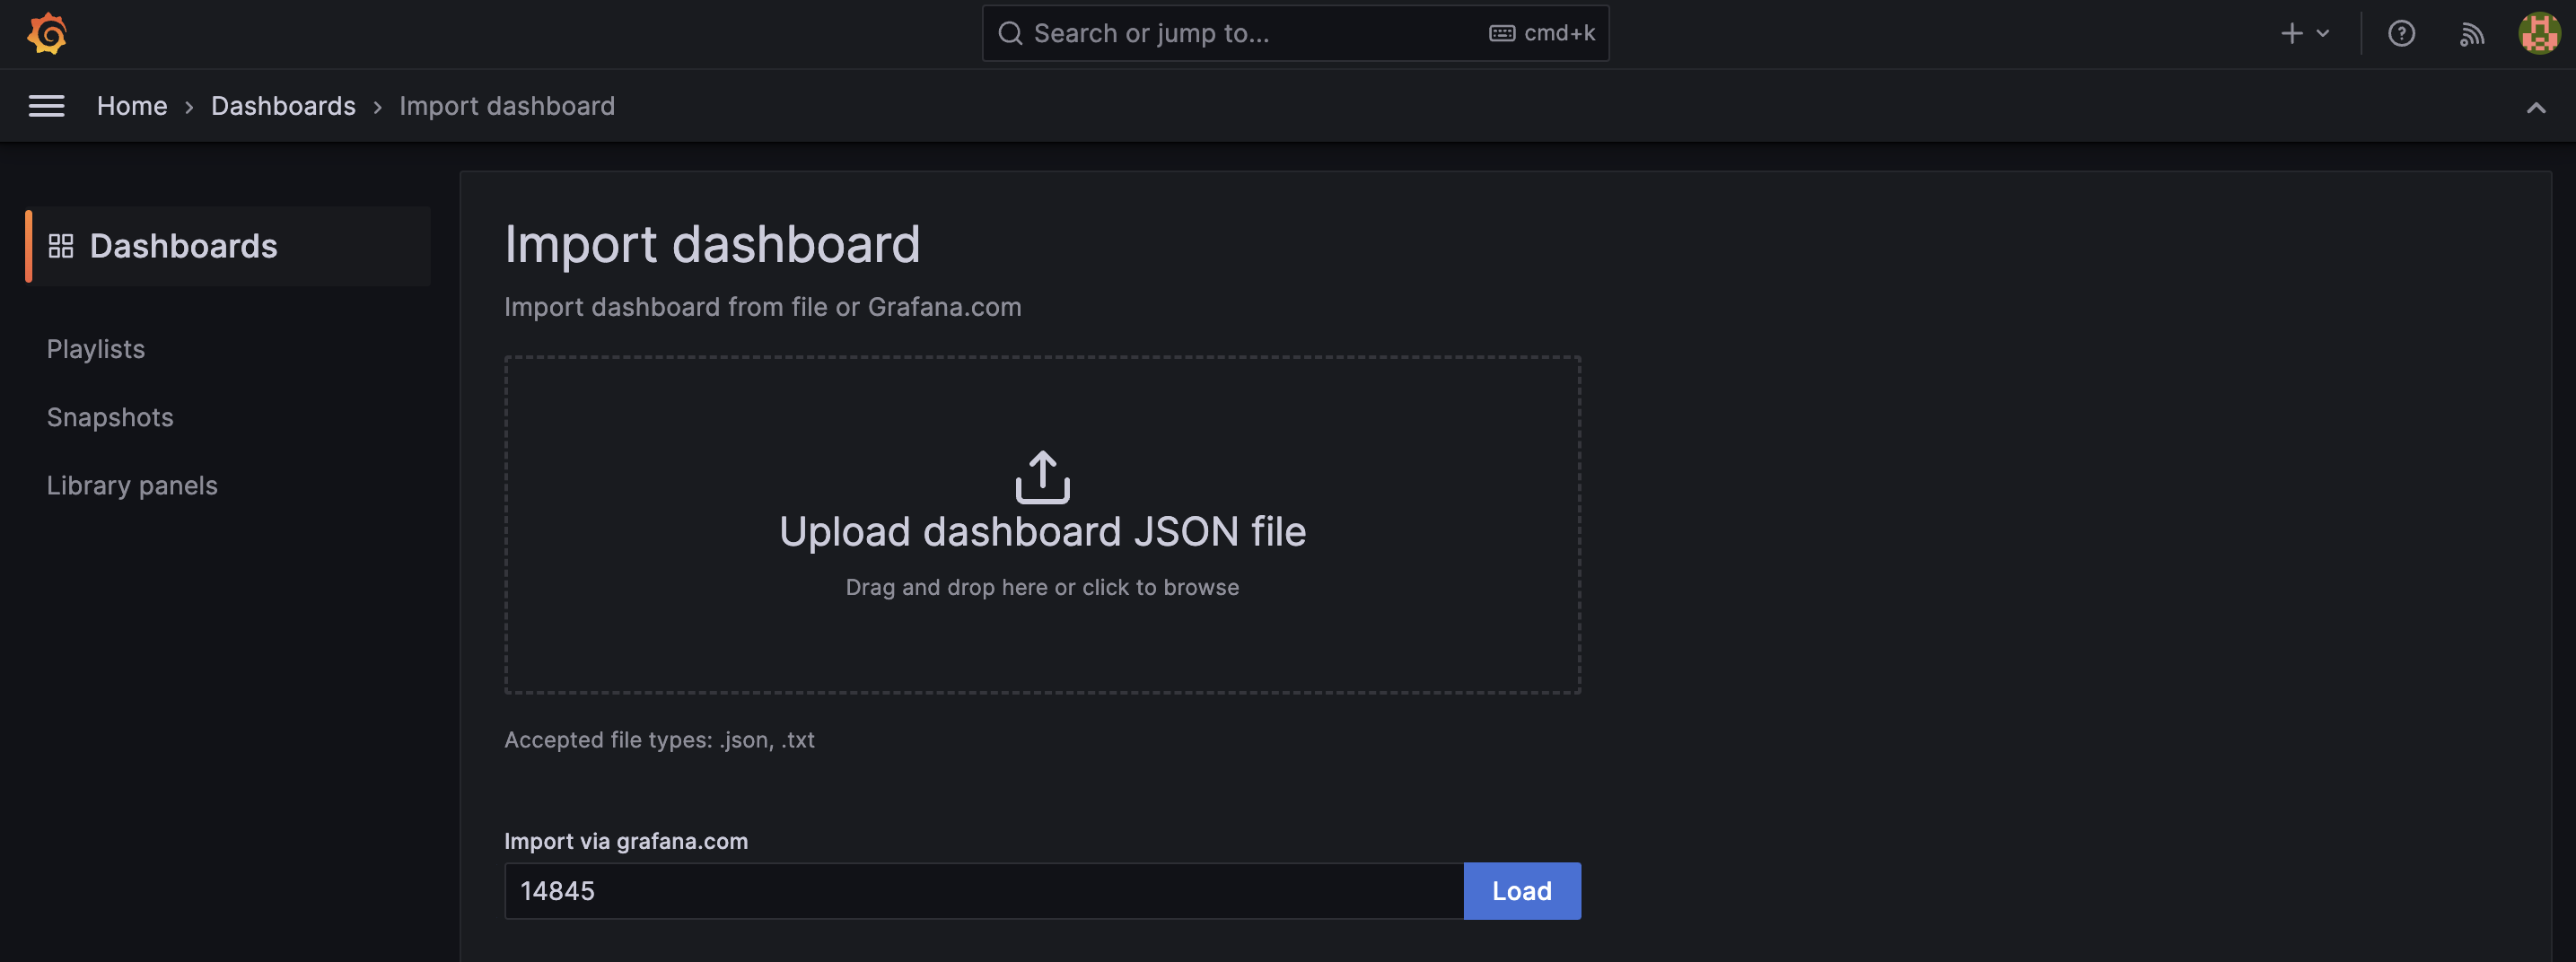
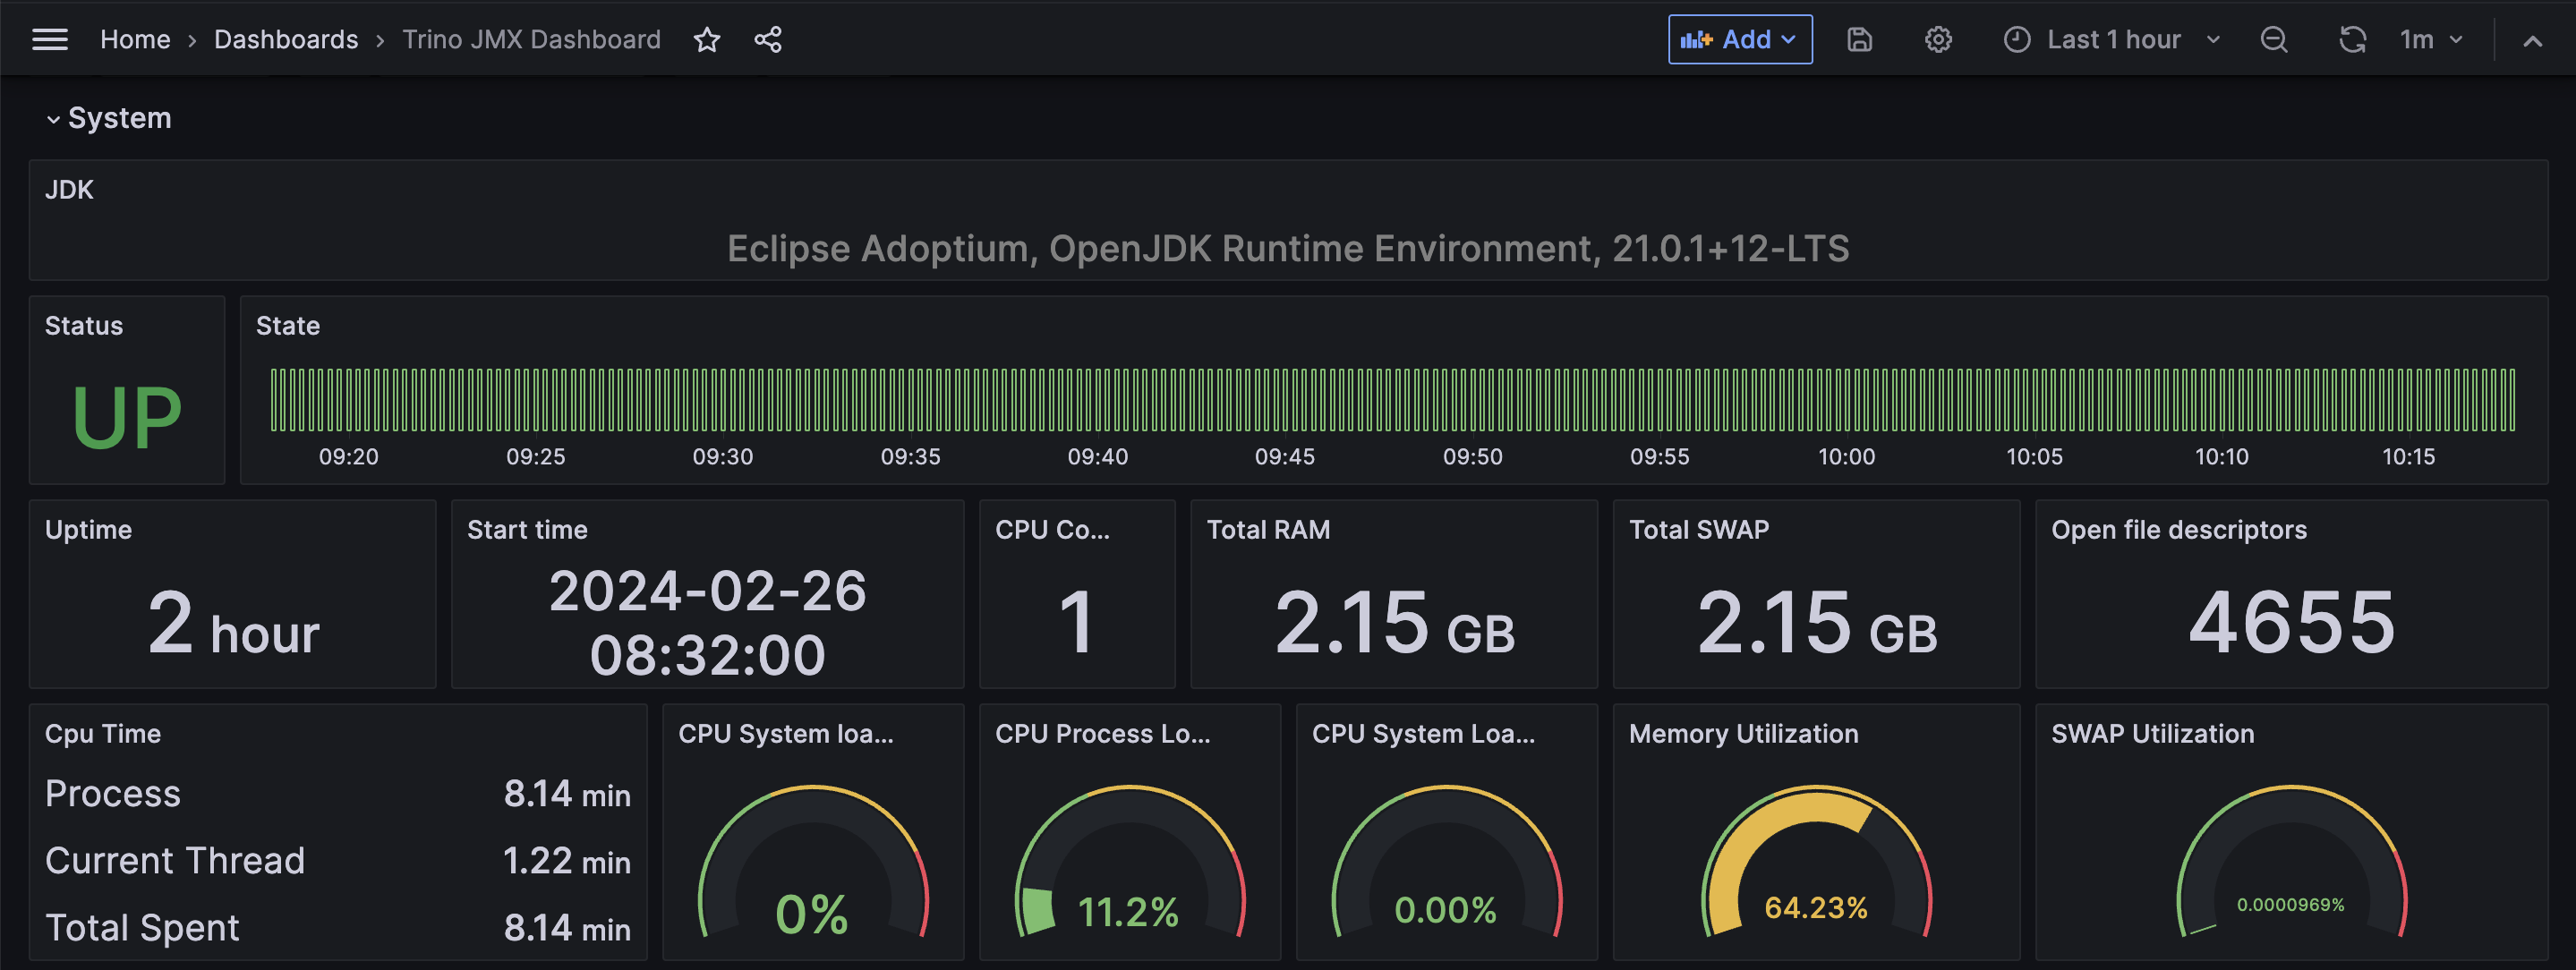
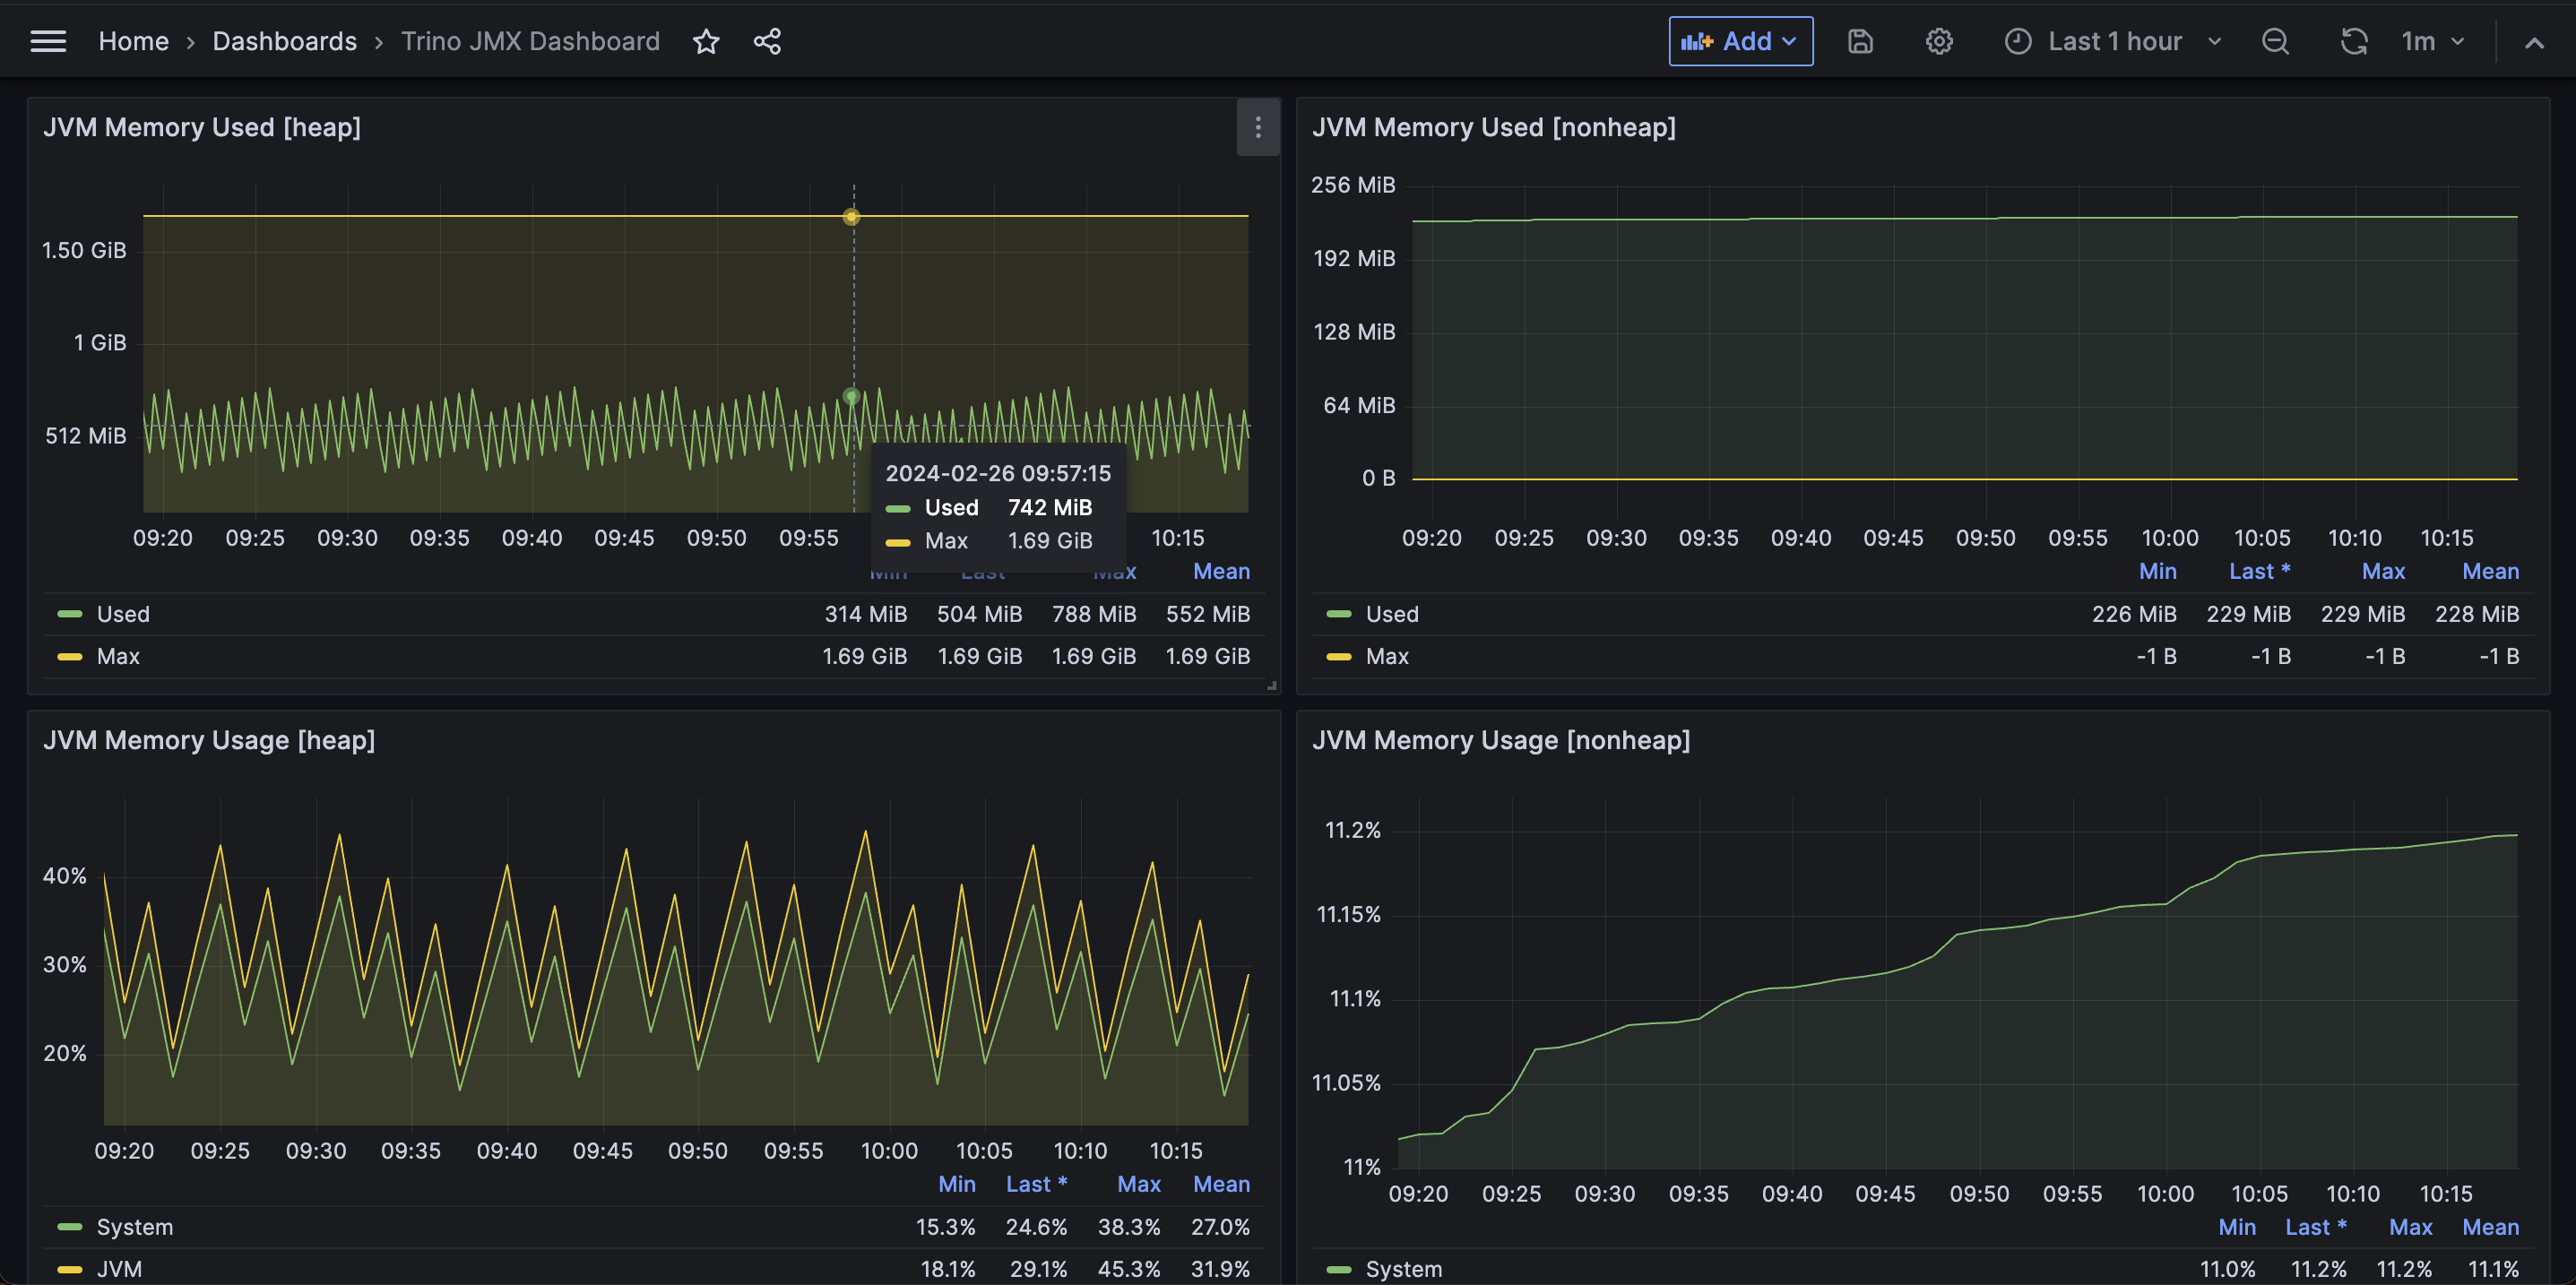
Import the JMX Dashboard(Basic) using the dashboard ID 14845. Grafana Dashboard
http://localhost:3000/dashboard/import
Trino JMX Metrics Dashboard
Troubleshooting
- JMX Metrics in Docker Container.
- JMX Exporter Configuration.
- How to expose JMX metrics in Kubernetes
TODO
- Add alerts for the JMX metrics.
- Add metrics for the Trino workers
- Shutting down the Trino workers gracefully.
Made with ❤️ by nil1729